sevenstarfx
New member
Market Wrap: Stocks, Bonds, Commodities
The benchmark S&P 500 closed higher in a choppy trade on Wednesday, as investors weighed an uptick in Treasury yields amid positive corporate results particularly from technology giants.The Dow Jones Industrial Average fell 42.77 points to 38,460.92, the S&P 500 gain 0.02% to 5,071.36 and the Nasdaq Composite ascend 16.11 points to 15,712.75.
MSCI’s index of Asia-Pacific stocks outside Japan is decrease 0.69% to 649.45 levels. The Australian index was lower by 0.01% to 7,683.00. Japanese Nikkei Index surged 0.04% today.
European stocks were mixed on Thursday, with the Stoxx Europe 50 Index decrease 0.28% to 4,976.15, Germany’s DAX drop 0.30% to 18,018.95, and France’s CAC lower 0.28% to 8,068.91 and U.K.’s FTSE 100 gain 0.67% to 8,094.50.
Benchmark 10-year U.S. Treasury rose as demand for safe assets surged again, today 10-year bond yields negative 0.13% to 4.649.
Oil prices were moderately lower on Wednesday as worries over conflict in the Middle East eased and business activity in the world’s largest oil consumer slowed, however, a fall in US crude oil inventories put a floor on those losses.
Spot Brent crude oil ascend 0.44% to $88.41 per barrel. US West Texas Intermediate crude is up 0.45% to $83.18 a barrel.
The yellow metal gold is decrease 0.03% to 2,337.85 dollars per ounce.
Market Wrap: Forex
The yen was pinned on the weaker side of 155 per dollar on Thursday as the Bank of Japan (BOJ) kicks off its two-day rate-setting meeting, leaving traders nervous as to whether Tokyo will intervene while policy deliberations are still underway.Today, the U.S. dollar index measures the Greenback against a trade-weighted basket of six major currencies, which drop 0.22% to 105.470.
The Euro US Dollar (EUR/USD) is a widely traded pair that is up 0.25% today. This left the pair trading around $1.0724.
The Japanese yen was negative against the U.S. dollar on Thursday. Today USD/JPY is surged 0.21% to the 155.66 level.
Another commodity-related currency positive against the U.S dollar, AUD/USD rose 0.42% to 0.6524, and NZD/USD surged 0.42% to 0.5960 level.
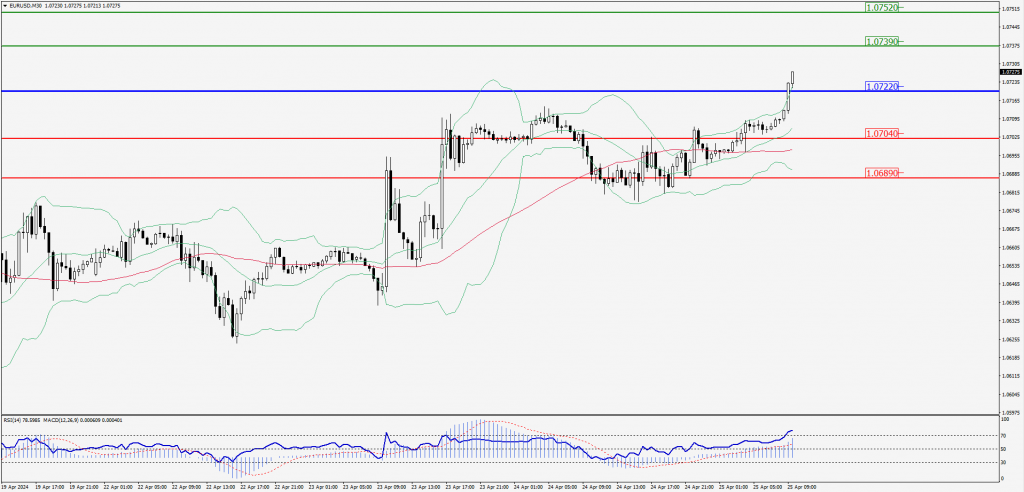
EUR/USD Intraday: Major trend on the upside
Our pivot point is at 1.07220Preferable Price Action: Take buy positions above pivot level with targets at 1.07390 & 1.07520 in extension.
Alternative Price Action: Below pivot looks for a further downside to 1.07040 & 1.06890.
Comment: RSI is above 50 levels and pairs above its 20MA & 55MA.
Green Lines Indicate Resistance Levels – Red Lines Indicate Support Levels
Light Blue is a Pivot Point – Black represents the price when the report was produced
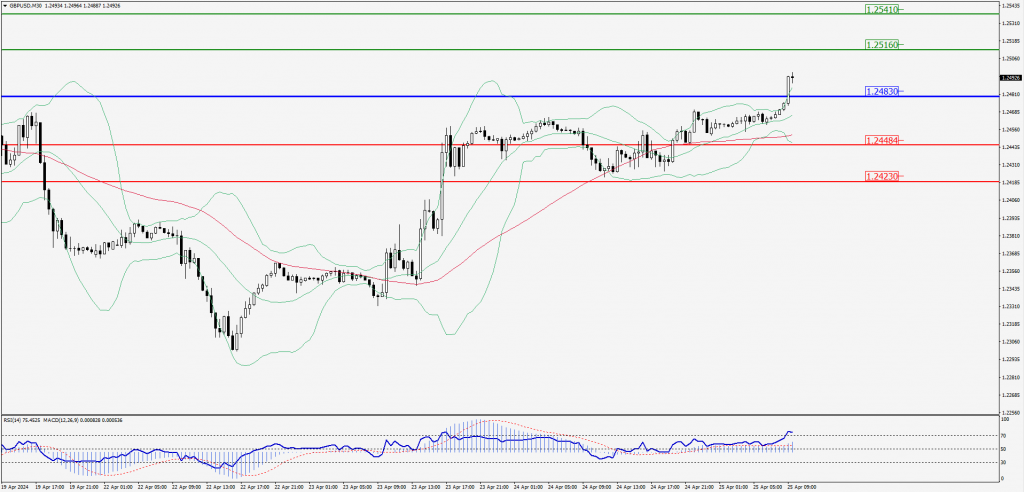
GBP/USD Intraday: Major trend on the upside
Our pivot point is at 1.24830Preferable Price Action: Buy positions above pivot with targets at 1.25160 & 1.25410 in extension.
Alternative Price Action: The price below pivot would call for further downside to 1.24484 & 1.24230.
Comment: RSI is above 50 levels and Pairs above its 20MA & 55MA.
Green Lines Indicate Resistance Levels – Red Lines Indicate Support Levels
Light Blue is a Pivot Point – Black represents the price when the report was produced
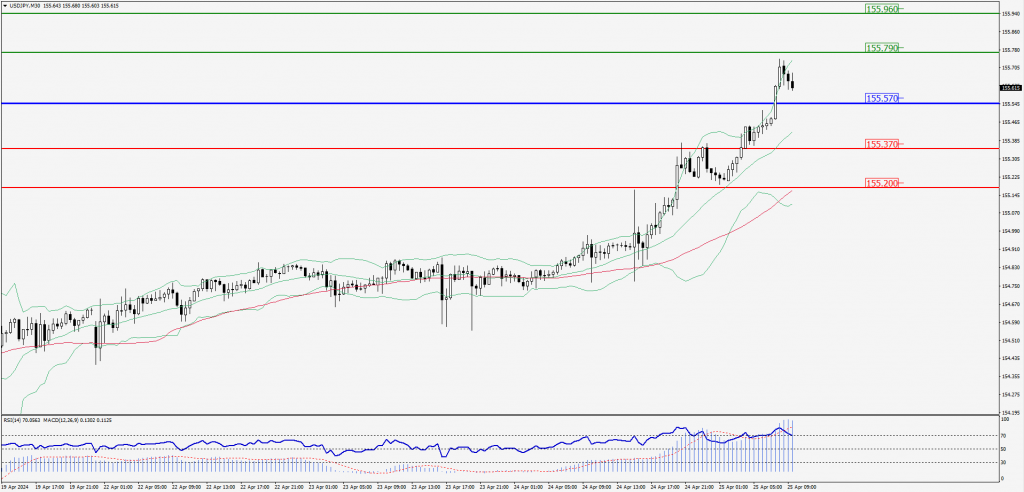
USD/JPY Intraday: Major trend on the upside
Our pivot point is at 155.570Preferable Price Action: Buy position above pivot with the target at 155.790 and 155.960 in extension.
Alternative Price Action: The downside breakout of the pivot would call for 155.370 and 155.200.
Comment: MACD is above 50 levels and Paris above its 20MA & 55MA.
Green Lines Indicate Resistance Levels – Red Lines Indicate Support Levels
Light Blue is a Pivot Point – Black represents the price when the report was produced
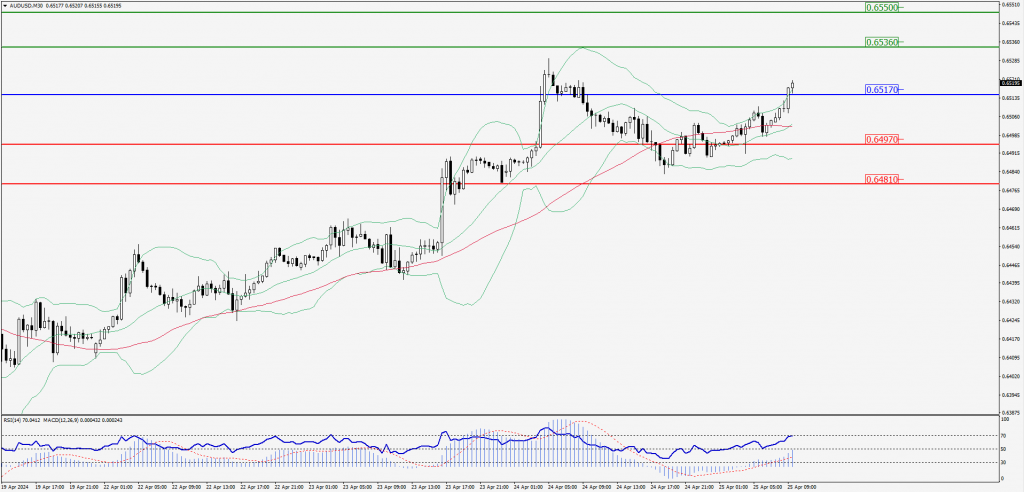
AUD/USD Intraday: Major trend on the upside
Our pivot point is at 0.65170Preferable Price Action: Buy positions above pivot with targets at 0.65360 & 0.65500 in extension.
Alternative Price Action: Below pivot looks for a further downside with 0.64970 & 0.64810 as targets.
Comment: RSI is above 50 levels and pairs above its 20MA & 55MA.
Green Lines Indicate Resistance Levels – Red Lines Indicate Support Levels
Light Blue is a Pivot Point – Black represents the price when the report was produced
CRUDEOIL Intraday: Support level at 82.72
Our pivot point is at 82.72Preferable Price Action: Above pivot buy oil with 83.31 & 83.71 as targets.
Alternative Price Action: Sell crude below pivot with targets at 82.11 and 81.71 in extension.
Comment: MACD is positive territory and pairs above its 20MA.
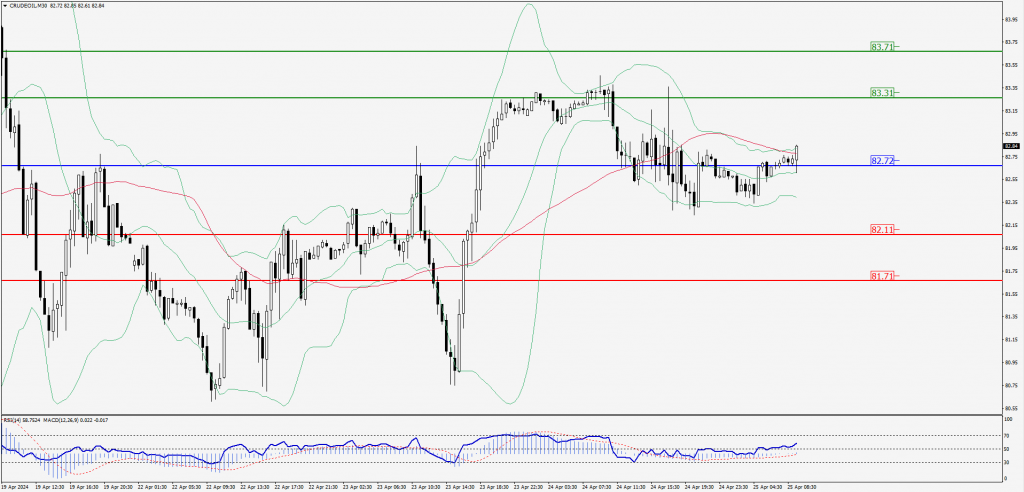
Green Lines Indicate Resistance Levels – Red Lines Indicate Support Levels
Light Blue is a Pivot Point – Black represents the price when the report was produced
XAU/USD Intraday: Trend at the upside
Our pivot point is 2318.40Preferable Price Action: Further upside to 2336.10 and 2349.70.
Alternative Price Action: If the price gives a downside breakout of a pivot, then the price extends to 2302.70 and 2290.80.
Comment: MACD is above 50 levels and pairs above its 20MA.
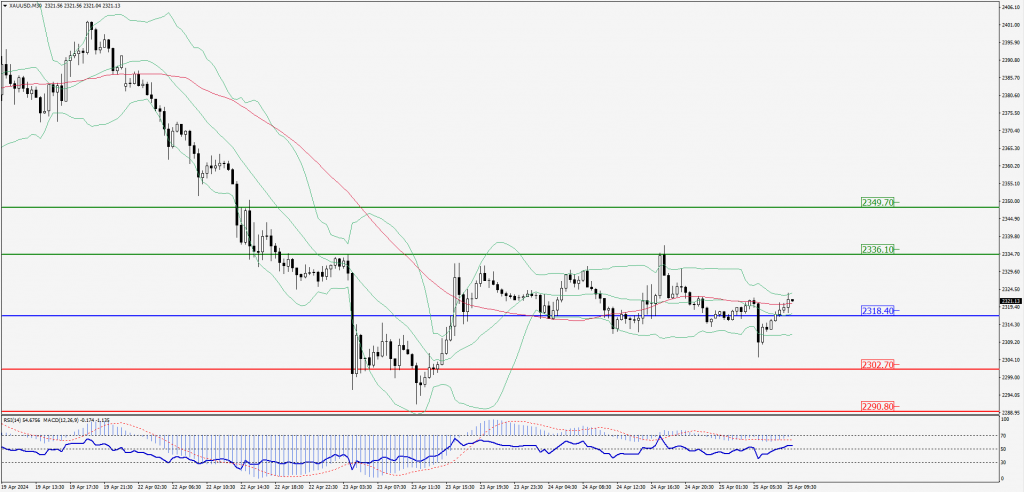
Green Lines Indicate Resistance Levels – Red Lines Indicate Support Levels
Light Blue is a Pivot Point – Black represents the price when the report was produced
Dow Jones Intraday: Trend on the downside
Our pivot point is 38,459.40Preferable Price Action: Take sell positions below the pivot with targets at 38,314.60 & 38,194.20.
Alternative Price Action: Above 38,459.40 looks for further upside to 38,596.00 & 38,696.80.
Comment: RSI is below 50 levels and Pairs below its 55MA.
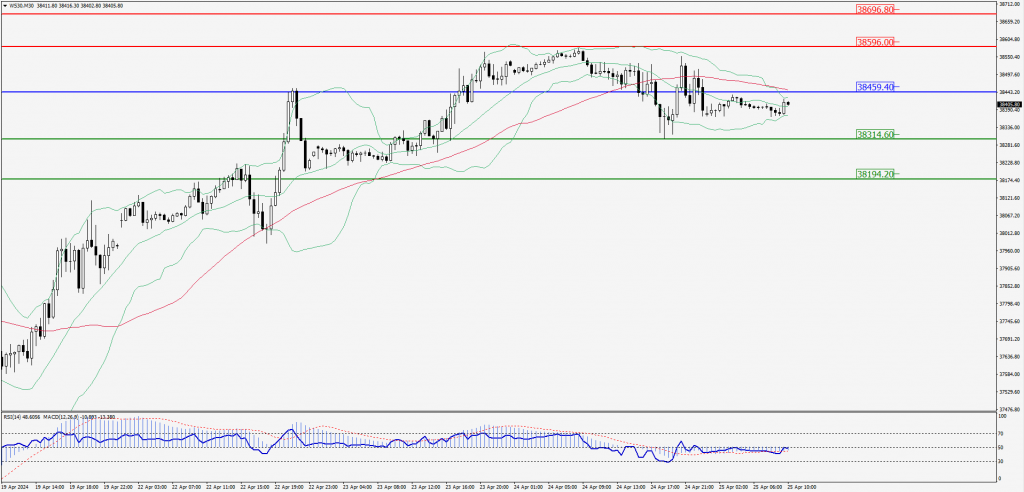
Green Lines Indicate Resistance Levels – Red Lines Indicate Support Levels
Light Blue is a Pivot Point – Black represents the price when the report was produced